top of page
Pipe Deformation Analysis (PDA)
Our deformation analysis is based on:
-
Analysing Caliper Data
-
Analyzing Deviation
-
Allows for tools to freely bend. A bend of 0.5° per 10m corresponds to an 80mm relative displacement of the distal portion.
Please see the examples below.

3D view of damaged zone

95mm OD Tool of 12m length with a 0.5° bending allowance per 10m could pass through the deformed casing.

107mm OD Tool of 7m length with a 1.5° bending allowance per 10m could pass through the deformed casing.


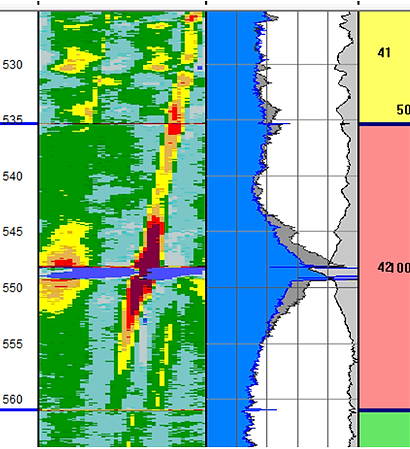
Broken joint patch at depth 548.5m. Joint #42. (2D & 3D View)

Broken joint patch at depth 548.5m. Cross section

Vertical profile of broken joint patch at depth 548.5m

STL model of damaged area for printing hard copy on 3D Printer

Fracking sleeve view in corrosion image log and vertical profile view.
The vertical profile view shows a starting width of 100mm and the caliper determines a pit depth of 35mm outside through the casing wall.

Fracking sleeve 3D view.


We can detect deformation of any calibre. Depending on the AER severity class (1 through 4), the consequences of a deformed pipe can lead to serious environmental contamination and production loss.

The Vertical Profile shows the exact value of casing deformation
bottom of page


